「ポテンシャルの角運動量展開」の二次元版だと思って頂いて差し支えない。
係数 はルジャンドル関数の直交関係から出て来る。
koideforest.hatenadiary.com
上記の式を用いて、まで展開してみる。
import numpy as np
from math import radians
from scipy.special import legendre
from scipy.integrate import simps
from scipy.interpolate import interp1d, interp2d
from matplotlib import pyplot as plt

def Plx( l, x ):
    # legendre( l ) >>> poly1d([ ... ])
    # poly1d([ ... ])( x ) >>> float
    return legendre( l )( x )

def pw_expand( func, l, r ):
    N = 300
    theta = np.linspace( 0., np.pi, N )
    coeff = ( 2 * l + 1 ) / 2.
    pw = []
    for rr in r:
        integrand = []
        for t in theta:
            x = rr * np.cos( t )
            y = rr * np.sin( t )
            integrand.append( coeff * np.sin( t ) * func( x, y ) * Plx( l, np.cos( t ) ) )
        print( np.array( integrand ) )
        pw.append( simps( np.array( integrand ), theta ) )
    return np.array( pw )

# For an interpolated function
def pw_expand_interp( func, l, r ):
    N = 300
    theta = np.linspace( 0., np.pi, N )
    coeff = ( 2 * l + 1 ) / 2.
    pw = []
    for rr in r:
        integrand = []
        for t in theta:
            x = rr * np.cos( t )
            y = rr * np.sin( t )
            integrand.append( coeff * np.sin( t ) * func( x, y )[0] * Plx( l, np.cos( t ) ) )
        pw.append( simps( np.array( integrand ), theta ) )
    return np.array( pw )
最初に、真四角の定数ポテンシャルを展開してみる。
N = 500
x = np.linspace( -2, 2, N )
y = np.linspace( -2, 2, N )
X, Y = np.meshgrid( x, y )

mat_v_const = np.zeros( ( N, N ) )
for ix, xx in enumerate( x ):
    for iy, yy in enumerate( y ):
        mat_v_const[ iy ][ ix ] = potential_const( xx, yy )

fig = plt.figure( figsize = ( 5, 4 ) )
ax = fig.add_subplot( 1, 1, 1 )
pcm = plt.pcolormesh( X, Y, mat_v_const, cmap = 'Greys' )
fig.colorbar( pcm )
plt.savefig( "v_const.png" )
plt.show()

角運動量は、球対称の時に保存量となるため、球対称に近い時に展開の収束が良いと言える。
これは、フーリエ変換の時に正弦波に近いほど収束が良いのと同じ話である。
そのため、不連続な境界を円周上に持つ真四角ポテンシャルの収束は、最悪だと予想出来る。
実際、全然収束しない。
r = np.linspace( 0, 2 * np.sqrt(2), 200 )
pws = []
for l in range( 10 + 1 ):
    pws.append( pw_expand( potential_const, l, r ) )

r = np.linspace( 0, 2 * np.sqrt(2), 200 )
f_const = [ interp1d( r, pws[ l ], kind = "cubic" ) for l in range( 10 + 1 ) ]
mat_pw_const = np.zeros( ( N, N ) )
l_max = 10
for ix, xx in enumerate( x ):
    for iy, yy in enumerate( y ):
        rr = np.linalg.norm([ xx, yy ])
        tt = np.arctan2( yy, xx )
        for l in range( l_max + 1 ):
            if l % 2 == 0:
                mat_pw_const[ iy ][ ix ] += f_const[l]( rr ) * Plx( l, np.cos( tt ) )

fig = plt.figure( figsize = ( 5, 4 ) )
ax = fig.add_subplot( 1, 1, 1 )
pcm = ax.pcolormesh( X, Y, mat_pw_const, cmap = "bwr", vmin = -1, vmax = 1 )
fig.colorbar( pcm )
plt.savefig( "pw_const_plot.png" )
plt.show()

元のポテンシャルとの差を取ると、展開が上手く行っていない部分がより分かり易くなる。
fig = plt.figure( figsize = ( 5, 4 ) )
ax = fig.add_subplot( 1, 1, 1 )
pcm = plt.pcolormesh( X, Y, mat_pw_const - mat_v_const, cmap = "bwr", vmin = -1, vmax = 1 )
fig.colorbar( pcm )
plt.savefig( "pw_const_plot_diff.png" )
plt.show()

各の成分に分解した
を見てみると、
が大きくなっても寄与が消える気配がない。
for ipw, pw in enumerate( pws ):
    plt.plot( r, pw, label = "{:d}".format( ipw ) )
plt.legend()
plt.savefig( "pw_const.png" )
plt.show()

が偶数の時だけ寄与する(
が奇数の時、パリティは奇)。
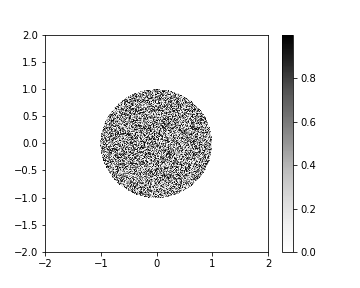
次に、境界は球対称だが、中身はランダムポテンシャルで対称性もクソもない場合。(後でポテンシャルを再利用するため、cubic splineで補間して関数として取っておく。)
import random

def potential_random( x, y ):
    if x**2 + y**2 <=1:
        return random.random()
    else:
        return 0.

mat_v_rand = np.zeros( ( N, N ) )
for ix, xx in enumerate( x ):
    for iy, yy in enumerate( y ):
        mat_v_rand[ iy ][ ix ] = potential_random( xx, yy )

f_mat_v = interp2d( x, y, mat_v_rand, kind = "cubic" )
mat_v_interp = np.zeros( ( N, N ) )
for ix, xx in enumerate( x ):
    for iy, yy in enumerate( y ):
        mat_v_interp[ iy ][ ix ] = f_mat_v( xx, yy )

fig = plt.figure( figsize = ( 5, 4 ) )
ax = fig.add_subplot( 1, 1, 1 )
pcm = plt.pcolormesh( X, Y, mat_v_interp, cmap = 'Greys' )
fig.colorbar( pcm )
plt.savefig( "v_rand.png" )
plt.show()

境界が丸いため、その部分は問題が無いが、やはり中身は苦労する。
pws_rand = []
for l in range( 10 + 1 ):
    pws_rand.append( pw_expand_interp( f_mat_v, l, r ) )

f_rand = [ interp1d( r, pws_rand[ l ], kind = "cubic" ) for l in range( 10 + 1 ) ]
mat_rand_pw = np.zeros( ( N, N ) )
l_max = 10
for ix, xx in enumerate( x ):
    for iy, yy in enumerate( y ):
        rr = np.linalg.norm([ xx, yy ])
        tt = np.arctan2( yy, xx )
        for l in range( l_max + 1 ):
            mat_rand_pw[ iy ][ ix ] += f_rand[l]( rr ) * Plx( l, np.cos( tt ) )

fig = plt.figure( figsize = ( 5, 4 ) )
ax = fig.add_subplot( 1, 1, 1 )
pcm = plt.pcolormesh( X, Y, mat_rand_pw, cmap = 'Greys', vmin = 0, vmax = 1 )
fig.colorbar( pcm )
plt.savefig( )
plt.show()

全然似ても似つかない。
差を取ると、何を再現出来ているのか不明なくらい差が大きい。
fig = plt.figure( figsize = ( 5, 4 ) )
ax = fig.add_subplot( 1, 1, 1 )
pcm = plt.pcolormesh( X, Y, mat_rand_pw - mat_v_interp, cmap = 'bwr', vmin = -1, vmax = 1 )
fig.colorbar( pcm )
plt.show()

もほぼ全ての
が寄与を持つ。
for ipw, pw in enumerate( pws_rand ):
        plt.plot( r, pw, label = "{:d}".format( ipw ) )
plt.legend( loc = 1 )
plt.savefig( "pw_rand.png" )
plt.show()

これらは、かなり非現実的なポテンシャルであるため、次回はもう少しマシなポテンシャルを展開してみたいと思う。